Expense Tracker App Design: A Budget Dashboard Redesign, Before and After
A budget dashboard with an eight-slice pie and a nine-point table, and the same screen fixed: one number first, one flat bar, plain rows and the month as the title. Every change side by side, with the free Figma file.
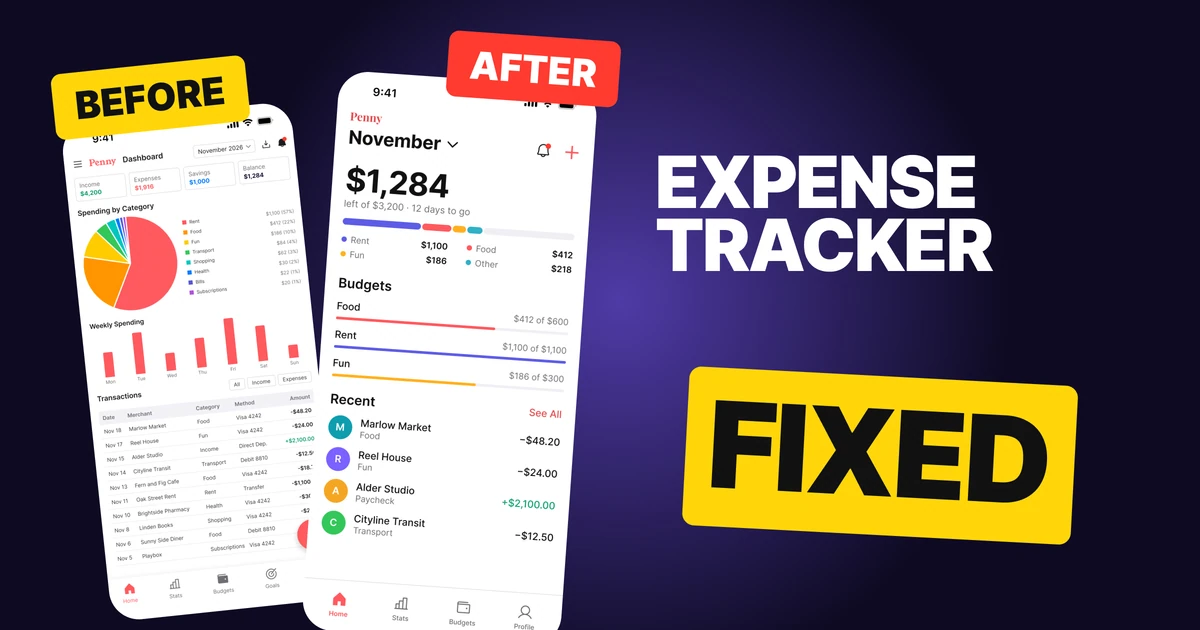
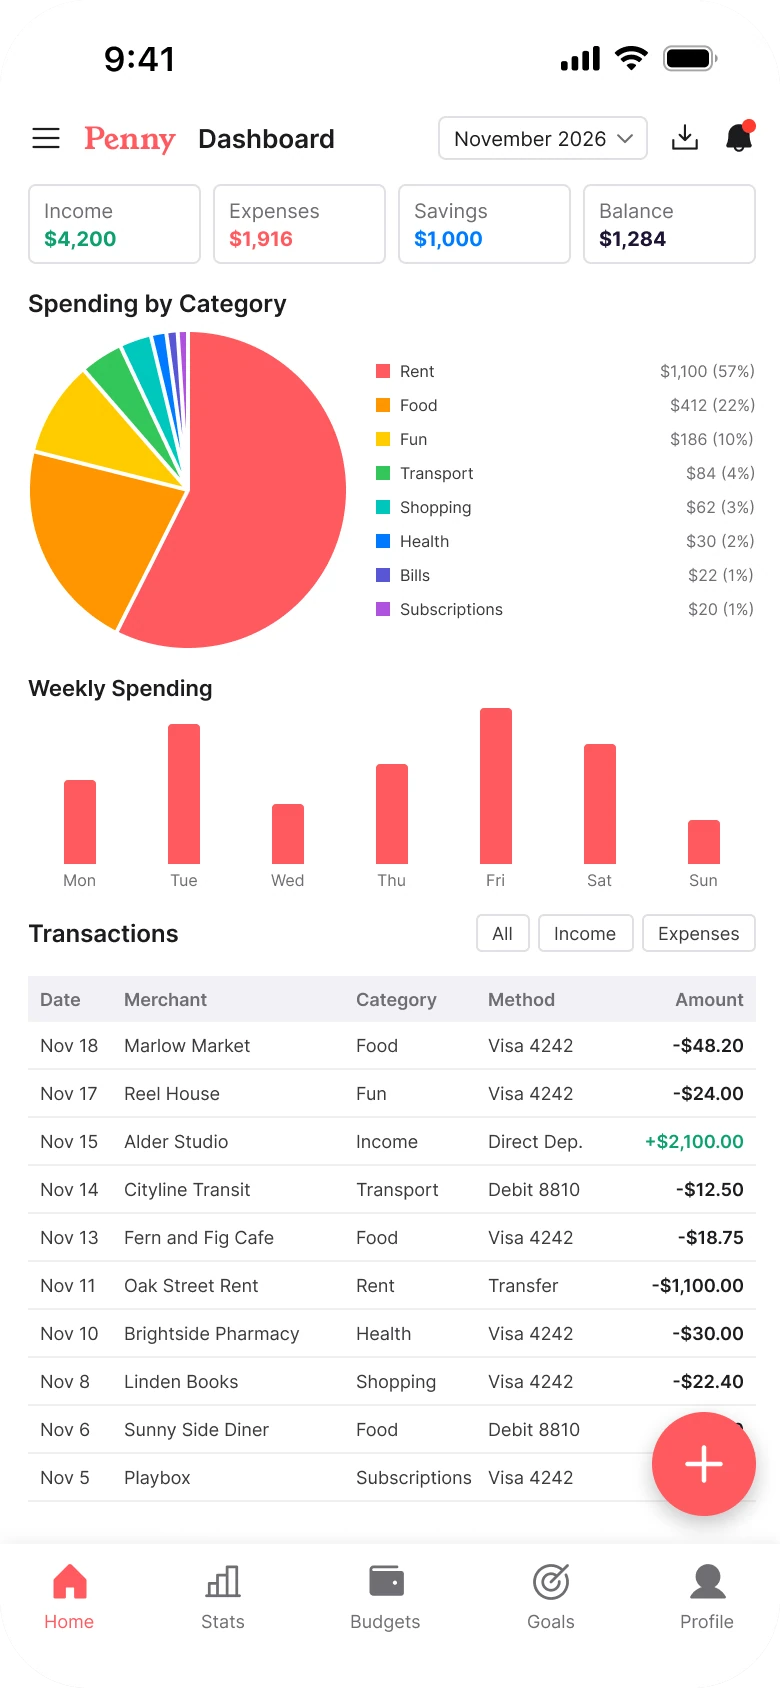
People open a budget app to learn one thing: how much can I still spend. The first draft below reports everything. The number sits in the last of four equal boxes at 10 px, the spending is an eight-slice pie with an 8 px legend, and the transactions are a five-column table at 9 px.
The fix keeps every function and changes the order. The number comes first and is huge, the pie becomes one flat bar, and the table becomes four plain rows people can read.
The whole screen, before and after
Junior draft
Fixed
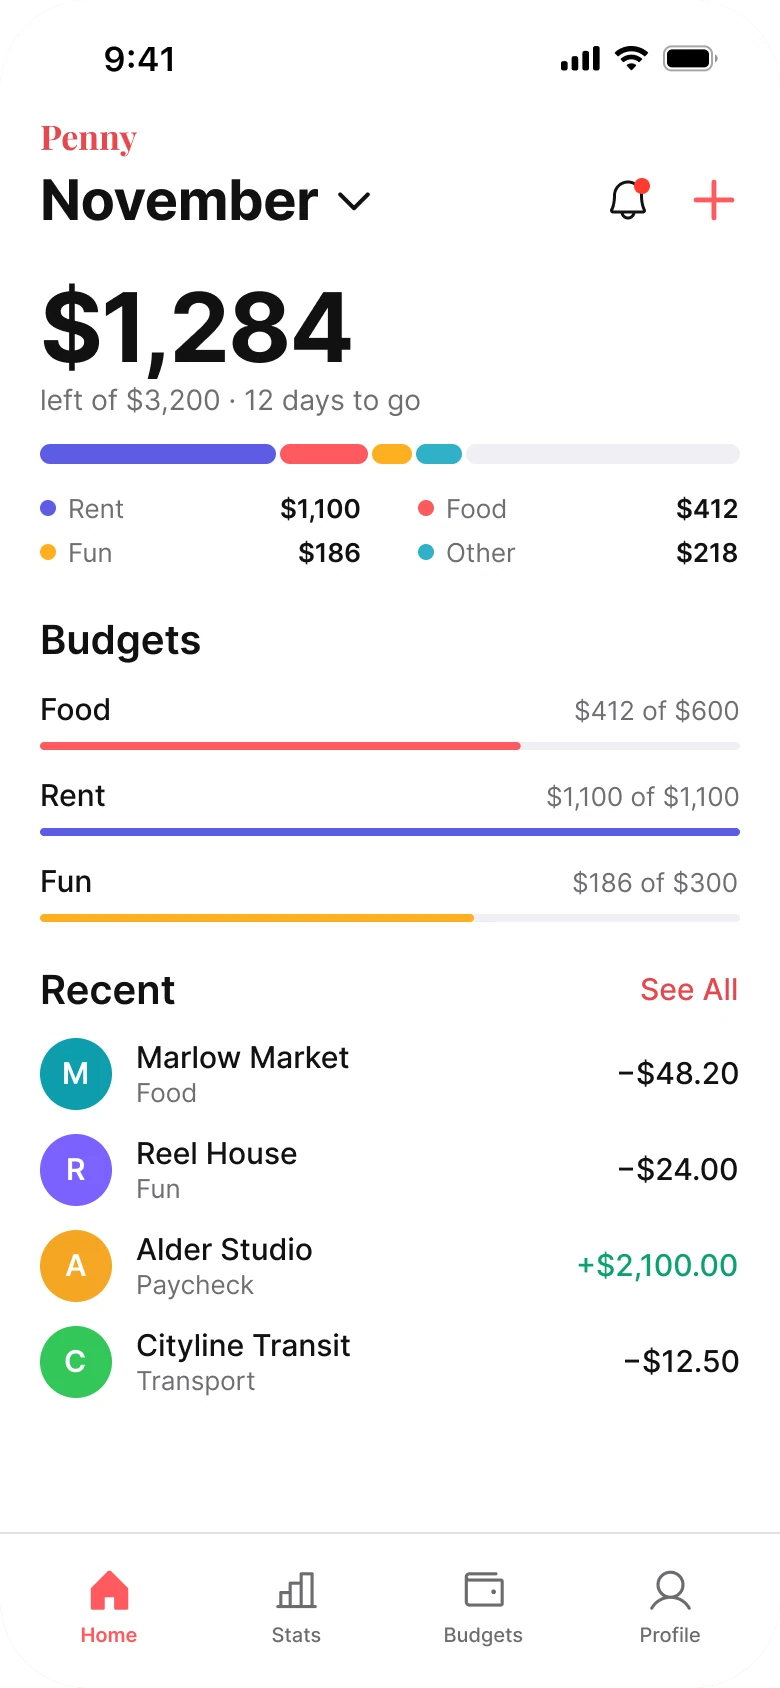
On the left, nothing leads. Four boxes, a pie, a bar chart, a filter row and a table all sit at about the same weight, and the answer to the only question is a 10 px figure in the fourth box. The eye has to scan the whole screen to find it.
On the right, the screen answers in order: how much is left, where did the rest go, what happened recently. One number is big, everything else is plain text, and there is one color job per element.
What changed, measured
| Junior draft | Fixed | |
|---|---|---|
| Ground | Four bordered boxes, a gray table header band | Plain white, no card, no tile, no shadow |
| Margins | 14 left, 12 right | 20 on both sides |
| Main number | $1,284 in the fourth box at 10 px | $1,284 at 48 bold, first on the screen |
| Spending | A 160 px pie, eight slices, 8 px legend | A flat stacked bar 10 px tall, a two by two legend |
| Budgets | Not shown | Plain rows, a 4 px bar under each |
| Transactions | Five columns at 9 px | Four rows at 15 and 13 px, 36 px letter circles |
| Title | Dropdown beside menu, export and bell | The month at 28 bold, wordmark small above |
| Tabs | Five, mixed filled and outline icons, floating plus | Four, flat 78 px bar with a hairline |
Fix 1: put what is left to spend first
Before

After

Four equal small boxes in a row: Income $4,200 in green, Expenses $1,916 in red, Savings $1,000 in blue and Balance $1,284 in black, all at 10 px, against $1,284 in huge bold type with left of $3,200 and 12 days to go in gray under it.
The four boxes give every number the same size, so none of them is the answer. The user has to know that Balance is the one that matters, and then read it at 10 px.
The fix picks one. $1,284 is 48 px bold, and the line under it carries the two facts that make it meaningful: the budget it comes from, $3,200, and the days left in the month. A number without its budget is trivia. With it, the user knows whether to worry.
The numbers add up, so nothing was invented to fit. Income of $4,200 less $1,000 of savings is the $3,200 budget, and $1,916 spent leaves $1,284. Income and Savings moved to the Stats tab.
Rule to reuse: find the one number the screen is opened for, make it the biggest thing on it, and write the context in one line under it.
Fix 2: one flat bar instead of a pie
Before
After
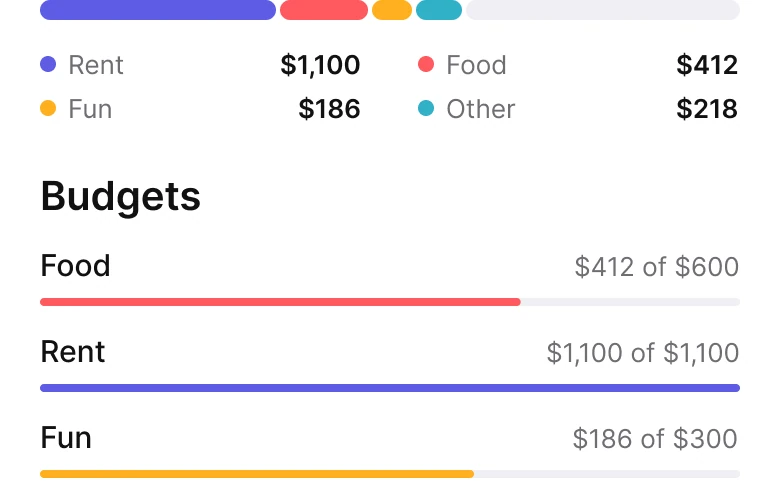
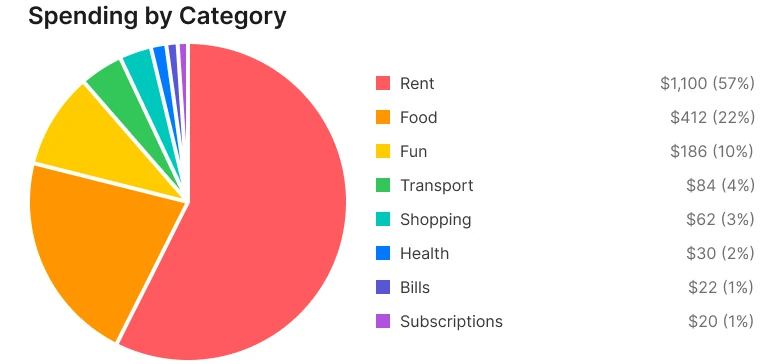
A large pie chart with eight colored slices labelled Rent, Food, Fun, Transport, Shopping, Health, Bills and Subscriptions with a tiny legend and percentages, against one thin stacked bar in indigo, coral, amber and teal with a pale end, a two by two legend of Rent $1,100, Food $412, Fun $186 and Other $218, and three budget rows with thin bars under them.
A pie is hard to read at the best of times, because people compare angles badly. Eight slices make it worse. Five of the slices are a few percent each, so they are slivers, and the legend that names them is 8 px.
The bar is read left to right, like a progress bar, which everyone already understands. It is drawn to scale against the $3,200 budget, so the pale end is the $1,284 still left, and the screen shows the same number twice in two forms. The five small categories roll up into Other, $218, and open in Budgets. The slices add up: 1,100 + 412 + 186 + 84 + 62 + 30 + 22 + 20 is $1,916.
Budgets sit right under as plain rows: a name, "$412 of $600" and a 4 px bar. A bar fills toward a limit, so it shows how close the user is to it. A pie cannot.
Rule to reuse: use one bar when the parts add up to a whole, and group the small parts into Other.
Fix 3: four rows, not a table
Before
After
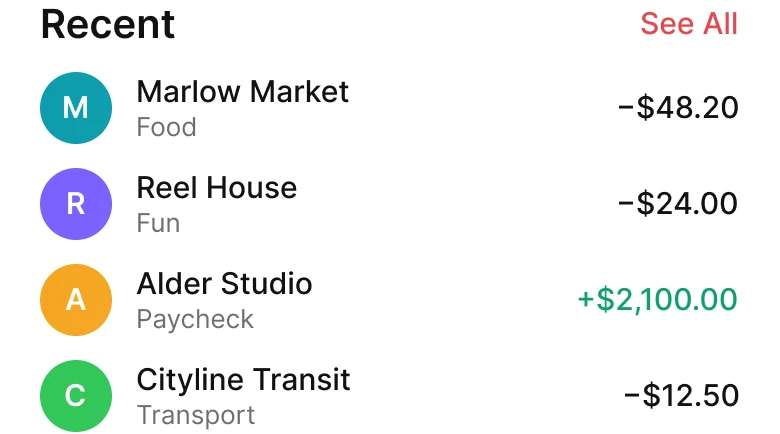
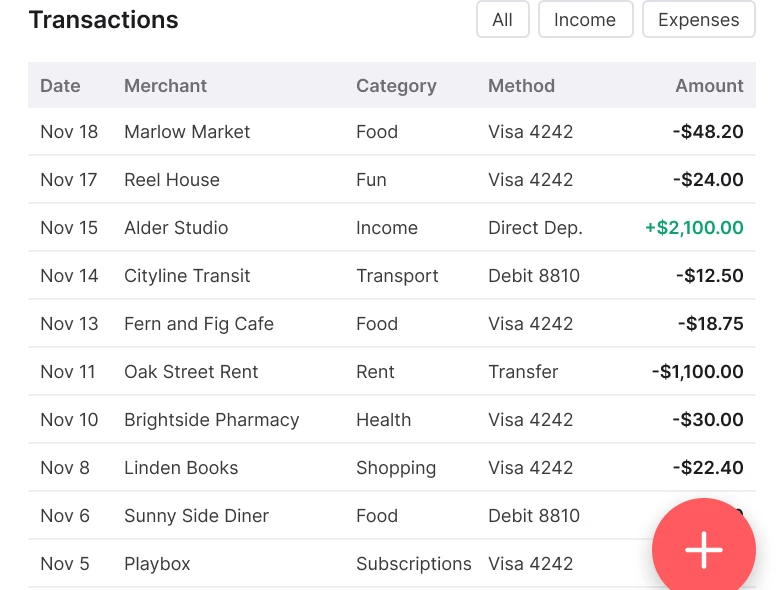
A Transactions heading with All, Income and Expenses filter buttons over a five-column table with Date, Merchant, Category, Method and Amount, ten rows of 9 px text and a floating coral plus button covering the last amounts, against a Recent heading with See All in coral and four rows: a teal M for Marlow Market, a violet R for Reel House, an amber A for Alder Studio with income in green, and a green C for Cityline Transit.
A five-column table at 9 px is a spreadsheet. On a phone it asks for squinting and for horizontal reading across a row, and the floating plus button sits on top of the amounts column, so the last figures are covered.
Four rows are enough for a home screen. A 36 px circle with the merchant's letter gives the eye something to hold, the merchant is 15, the category is 13 and gray, and the amount sits on the right. Income is the only green on the list, so the paycheck stands out without a label. Date, payment method and filters open from See All and from each row, so nothing is lost.
Rule to reuse: a home screen shows the recent few, not the full history. Put the filters behind See All.
Fix 4: make the month the title
Before

After

A header row with a menu icon, the coral word Penny, the word Dashboard, a November 2026 dropdown, an export icon and a bell with a red dot, against a small coral Penny wordmark above November in 28 point bold with a chevron, a bell with a red dot and a coral plus.
The draft header holds six things at one size: menu, wordmark, a "Dashboard" label that says nothing, a dropdown, export and a bell. The dropdown is the control people actually use, and it is the smallest.
The fix gives the screen a title and the title is the control. "November" is 28 bold with a chevron, the wordmark is small on its own line, and the plus moved from a floating button to the header, next to the bell. The menu and the Dashboard label moved to the Profile tab, and export moved to Stats.
Rule to reuse: if the main control is a filter, make it the title.
The smaller fixes
- Every function stays. The weekly chart, Income and Savings move to Stats. The five small categories roll up into Other and open in Budgets along with Goals. Filters, dates and payment method open from See All and from each row.
- Even margins. The draft has 14 px on the left and 12 px on the right. The fix uses 20 on both.
- No boxes. The fix has no card, no tile and no shadow. Space and type separate things.
- Fewer tabs. Four tabs in a flat 78 px bar with a hairline, in place of five with mixed filled and outline icons.
- Type scale. Text runs 13 to 48 px, against the draft's 8 to 13 px.
- Room under the content. The fix ends 67 px above the tab bar, so nothing is cut or covered. In the draft a floating plus sits over the table.
Audit your own budget screen
| Question | Why it matters |
|---|---|
| Is the number people open the app for the biggest thing on screen? | Everyone should find it in a glance |
| Does it say what the number is out of? | A figure without its budget is trivia |
| Do the parts of a chart add up to a whole you can show as one bar? | A bar is read faster than angles |
| Can you read every row at arm's length? | 9 px is a spreadsheet |
| Is the main control the title? | The most used control should not be the smallest |
| Does a floating button cover content? | It hides the figures it sits on |
Get the Figma file
The free file has the junior draft, the fixed screen and every part as a component.
Free Figma file
Expense tracker screen redesign, before and after
Both screens and every part as a Figma component. Free, view only, duplicate it to your drafts.
FAQ
How should an expense tracker home screen be designed?
Lead with what is left to spend, large, with the budget and days to go in one line under it. Then one flat bar for where the money went, a few plain budget rows and the four most recent transactions, with the rest behind See All.
Is a pie chart or a bar better for spending categories?
A flat stacked bar, when the parts add up to a whole. People read length faster than angle, and small categories stay visible as a bar segment instead of a sliver. Group the smallest into Other.
How many categories should a budget chart show?
Three or four. In this screen five small categories roll up into Other, $218, and open in Budgets, so the bar stays readable.
How big should the main number be in a finance app?
Big enough to be the first thing seen. Here the balance is 48 px bold, against 28 px for the month title and 15 px for the rows.
How many transactions should a home screen show?
Four to five rows, at 13 to 15 px, with a See All link for the full list, filters and payment method.
What should the tab bar of a budget app contain?
Four tabs are enough: Home, Stats, Budgets and Profile. Goals live inside Budgets.
Sources
- Both screens are our own, designed and measured in Figma. The app, Penny, its merchants and its amounts are made up. The figures are consistent on both screens: income $4,200 less savings $1,000 is the $3,200 budget, spent $1,916 leaves $1,284, and 12 days to go means November 18, the date of the newest transaction.
- Pattern studied: Copilot Money and Monarch, with one number left to spend, one bar for the categories, plain rows and a flat tab bar.
- Icons are from Phosphor (MIT). No photos are used.
- First published as a carousel on App Brainy.
Want this for your own app? Our team redesigns app screens like this one, from the first audit to the finished components.
Get StartedGet new papers by email
New Brainy papers in your inbox. Confirm once, unsubscribe anytime.